Clean Water Prioritization Tool (CWPT)
An Application to Leduc County, Alberta
2019-05-22

Introduction
The Alberta Biodiversity Monitoring Institute has developed a Clean Water Prioritization Tool (CWPT) to help guide water resource managers, landowners, and extension agents in maintaining and enhancing water-related ecosystem services throughout their area of interest. Protecting the health and quality of streams, rivers, and lakes is a goal common to many jurisdictions throughout the province, and practical guidance on where to target conservation and management efforts in an efficient manner is needed.
Based off a methodology developed by the Natural Capital Project (2018), the CWPT is a spatially-explicit mapping product designed to provide information on the relative importance of each quarter-section in influencing the provision of clean surface water. The tool also gives guidance on possible management actions at each quarter to improve or maintain service delivery. Designed around the objective of reducing excess nutrient (phosphorus, nitrogen) and sediment loading into aquatic systems, the CWPT can be used to help promote downstream water quality improvements, which can potentially decrease water treatment costs and lower pollutant-related health risks to humans and livestock.
Modeled Landscape Attributes
The non-point source runoff of nutrients and sediment across the landscape is estimated using export and loading coefficients developed specifically for major landcover and human footprint types in the Alberta context (Donahue, 2013). This information is used in conjunction with annual precipitation data, detailed landcover and human footprint information1, and the simulation of overland flow based on a hydrologically corrected 15m digital elevation model (Habib et al 2016). From this, the CWPT relies on three modeled attributes of the landscape to evaluate the relative importance of each quarter-section in an area of interest:
Upslope Accumulation: The sum total of nutrients and sediment exported from upslope areas whose flow paths move through the quarter-section.
Downslope Retention: The sum total of nutrient and sediment retention potential of all downslope areas along the flow path from the quarter-section to a stream, river, or lake.
On-pixel Contribution: The nutrient source and retention capabilities of each quarter-section.
Components of the CWPT
There are two components of the CWPT, and they are designed to address the following applied questions (in order):
Where do I target my efforts to achieve gains in water quality? and
Which management actions are appropriate once I get there?
The first component, landscape position importance, attempts to answer the first question by ranking each quarter-section based on its relative potential to impact downstream water quality. The second, on-pixel contribution, can be used to guide appropriate management actions.
1. Landscape Position Importance
The relative importance of each quarter-section in terms of water purification depends on the first two landscape attributes, both of which are highly related to landscape position and nearby land use.
With respect to upslope accumulation, quarters that are topographically situated such that they receive large amounts of nutrient and/or sediment runoff from upslope areas will have a greater opportunity to trap these pollutants. Note that this can be due to either draining a large area, or draining an area with high runoff (e.g. due to intensive development) - or for both reasons.
Importance is also reflected by the second attribute, downslope retention potential. This attribute refers to the length of the flow path downslope of the quarter before flowing into a stream or river, weighted by the ability of land along that path to filter and trap nutrients/sediment. If downslope retention potential is low (due to a short flow path and/or highly developed land along it), management actions on the quarter will be relatively more beneficial for water purification. Conversely, if retention potential downslope is high, the area will be less important.
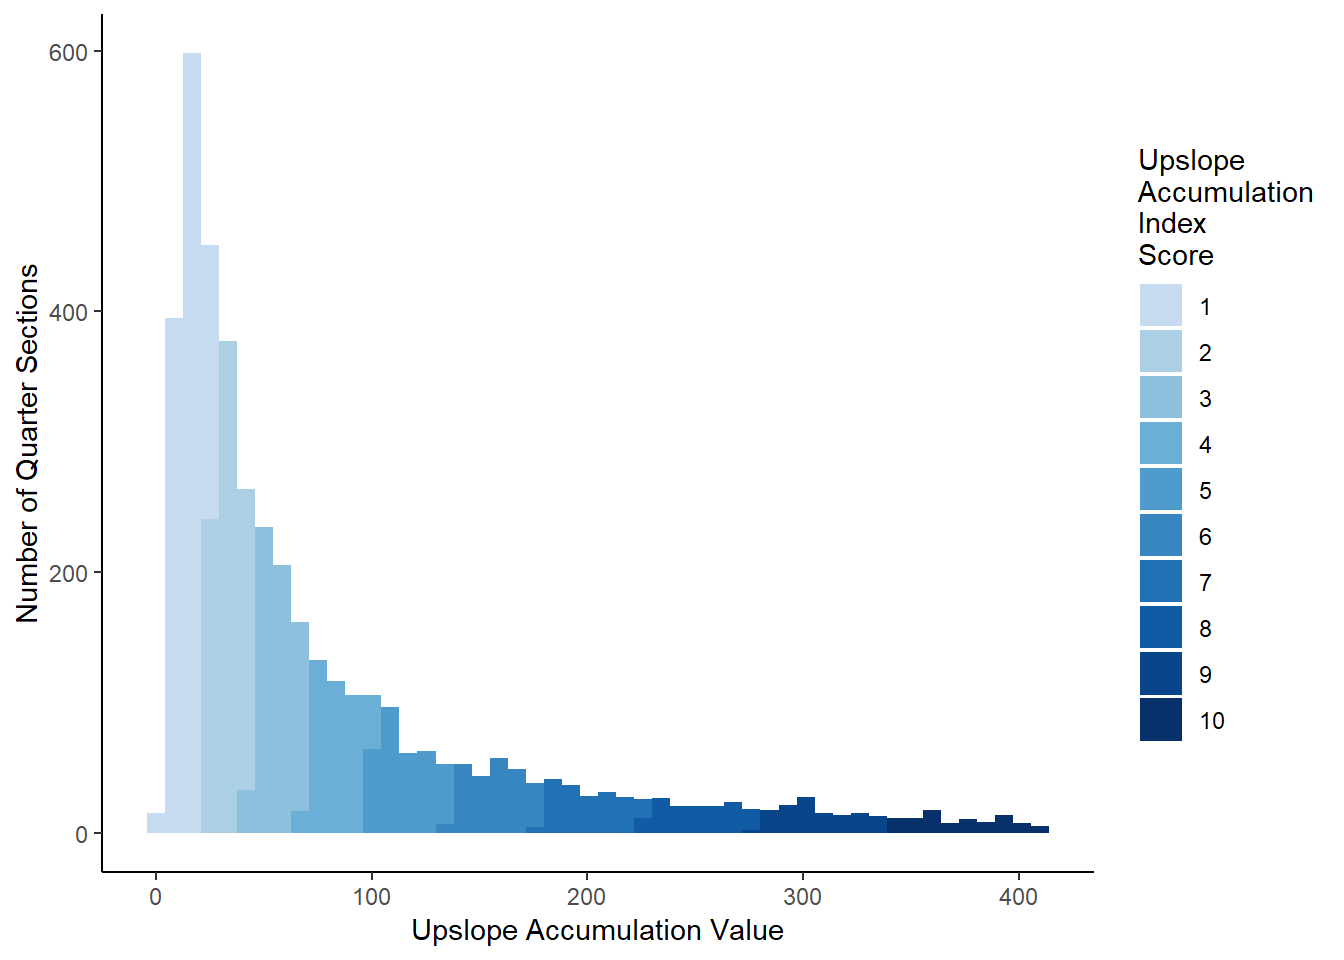
For both of these continuous variables, each quarter is binned into one of ten groups and assigned an index score between 1 and 10. The binning procedure follows the Jenks natural breaks classification method, in which quarters with similiar values are grouped together2. The distribution among quarters in Leduc County in both upslope accumulation and downslope retention, along with the index score assigned, can be viewed in the figures below.
The figure to the right displays the distribution of upslope accumulation values calculated for each quarter-section in Leduc County. As a right-skewed distribution, the majority of quarters receive a low index score (1-4), which means a relatively low amount of nutrients and/or sediment flow into them from upslope areas. Conversely, those quarters with high values receive a higher load.
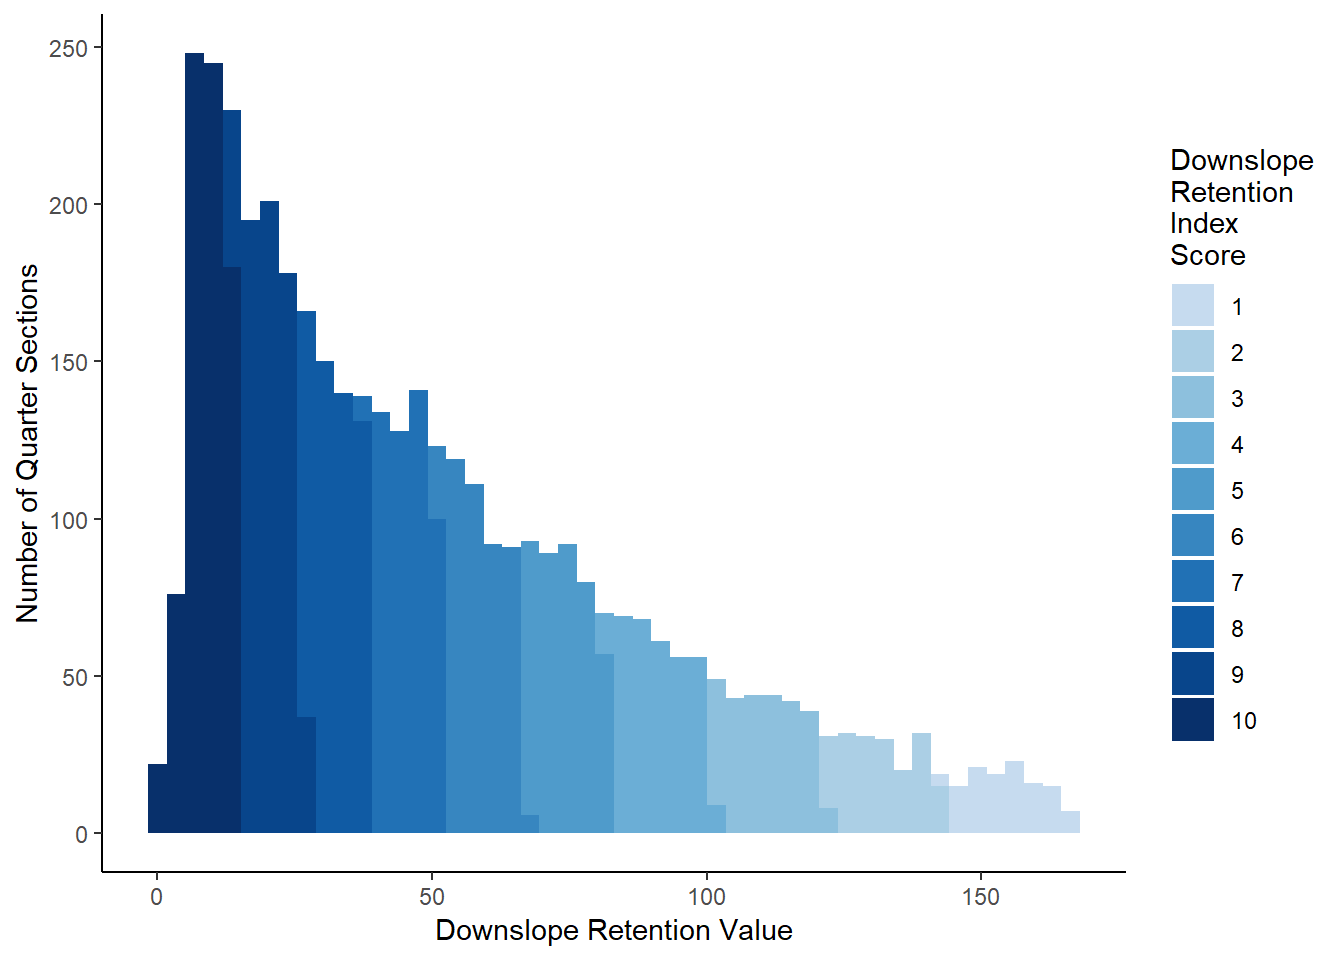
This figure displays the distribution of the second landscape attribute, downslope retention potential, calculated for each quarter-section in Leduc County. It is important to note that the index scores are reversed compared to upslope accumulation, since quarters with lower downslope retention values are actually more important in terms of their ability to deliver water purification services (thus reflected by a higher score).
An overall Landscape Position Importance Score is calculated as the average between the two intermediate scores. As such, the relative importance of a quarter-section within a given area of interest is based on a combination of both landscape attributes. The higher the score, the more important that quarter-section is (relative to others in an area of interest) to water purification services.
The map below displays the landscape importance score associated with each quarter-section located within Leduc County, Alberta. From this map, the user can also select a specific quarter-section to retrieve the legal land description and importance score, as well as view satellite imagery.
2. On-Pixel Contribution
The second component of the CWPT involves the third landscape attribute, on-pixel (i.e. quarter-section) contribution. The nutrient and sediment load generated at each quarter-section is calculated using export coefficients from Donahue (2013). Similar to the other two attributes, the Jenks natural breaks classification method is used to bin each quarter section into one of ten groups, and given a score from 1-10.
Rather than reflecting a progressive state of importance, this score represents a diverging scale that provides an indication as to what type of management actions may be appropriate in regard to water purification. For example, a quarter-section with a low on-pixel contribution score will be generating a relatively small amount of nutrient and sediment runoff. In this case, the combination of low on-pixel sources and a high nutrient retention rate suggest that management oriented around conservation of existing landcover is most suitable.
On the other hand, a high on-pixel score would indicate that a high amount of nutrient and sediment runoff is occurring (due to high on-pixel sources and/or low rentention rates) and that restoration and/or mitigation actions should be prioritized. Such activities, for example, may include planting native vegetation or permanent cover, revegetating riparian areas, livestock management, and fertilizer management.
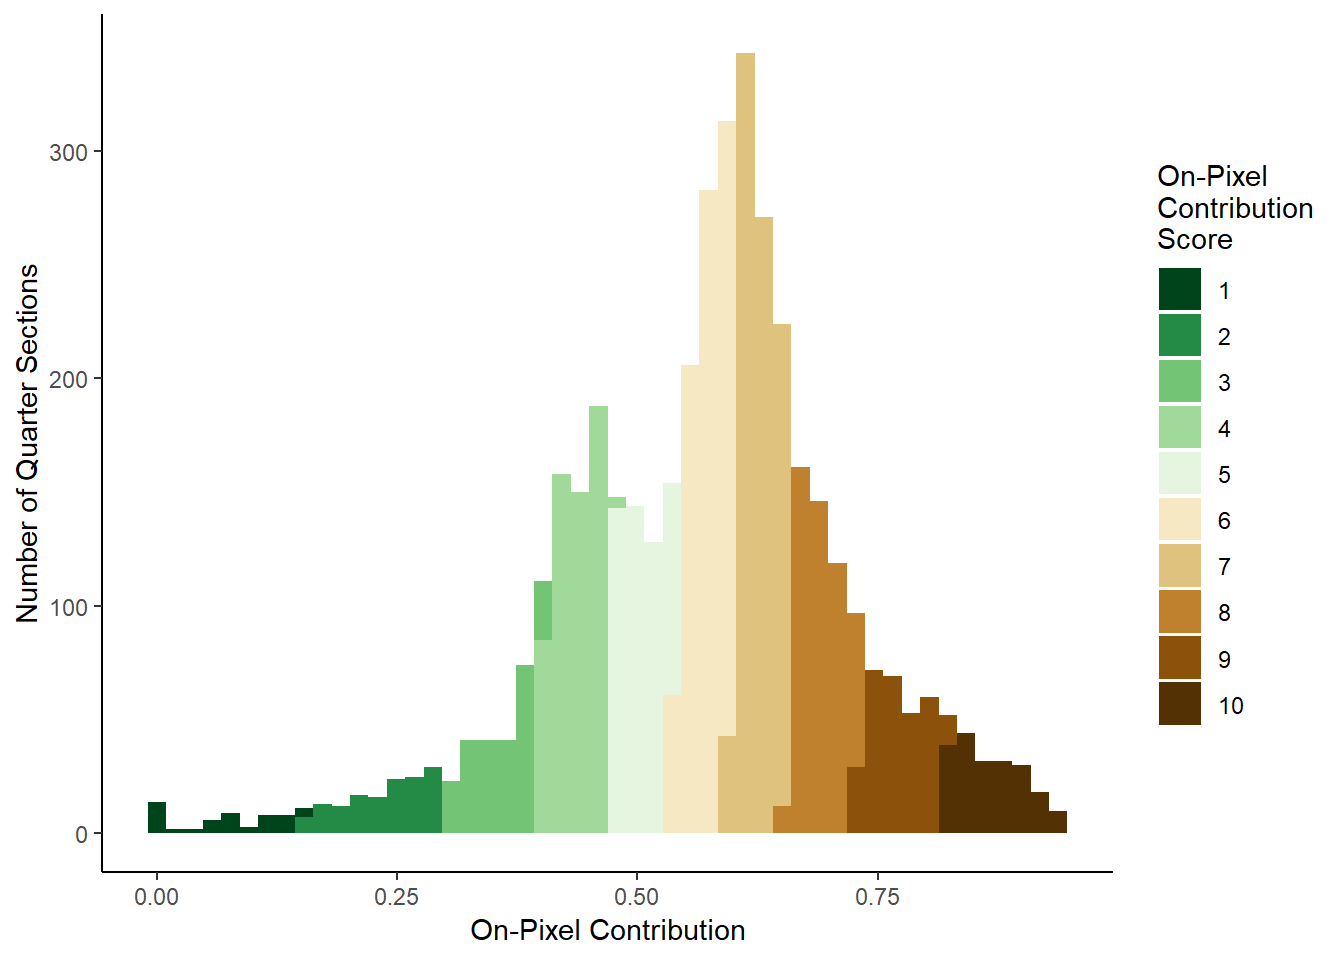
This figure displays the distribution of the third landscape attribute, on-pixel contribution, calculated for each quarter-section in Leduc County. This attribute more normally distributed, leading to higher number of quarter-sections with middling scores (e.g. 4-7). Areas with higher scores are generally associated with more intensive and developed land uses. Conversely, quarters with low scores will often contain a greater proportion of native cover.
Both components of the CWPT are designed be used in tandem to identify priority quarter-sections within an area of interest and plan appropriate management actions. The map below displays the on-pixel contribution score associated with each quarter-section in the Leduc County; however, the user can filter the data to view only those quarter-sections that score within a user-specified range on the landscape position importance score. Once positionally-important areas are identified, the on-pixel score can be used as an indicator of which suite of management actions would be suitable at each site.
In addition, if agricultural areas are targeted for on-the-ground projects, the second slider can be used to filter for quarter-sections that meet a user-specified threshold of agricultural use3. The table below can be used to create additional queries as well as download the raw quarter-section data for use in other software.
Summary
The CWPT can be used to identify priority areas and guide the placement of conservation and restoration projects on the landscape. The first index score, landscape importance, indicates the relative importance of each quarter-section within a region, whereas the second score, on-pixel contribution, can be used as a guide for deciding upon the appropriate course of action.
It is important to keep in mind that local conditions will vary widely at each site, and that some management actions may be more suitable/effective than others. Using this tool as a first-step screening process, landowners, managers, and extension officials can work together to determine a mutually beneficial course of action to improve or mantain water-related ecosystem services.
Information on ABMI’s Human Footprint inventory is available here.↩
The method used here is the Fisher-Jenks algorithm, first proposed by Fisher (1958) and subsequently discussed by Slocum et al (2005). This algorithm seeks to minimize within-group variance and maximize between-group variance.↩
The calculated proportion of agriculture in each quarter section is based on the Human Footprint inventory (2016) developed by the ABMI.↩