The assumption that animals are not attracted to or repelled by the camera implies that no lure or other attractant is used. However, results from lured deployments can be used if a factor is included to account for how much the lure increases the effective field-of-view for attracted species. ABMI chose to use lure at half their deployments, and no lure at the others. Lure is intended to attract more carnivores, which are generally rare and therefore subject to high uncertainty. However, long-term trend is a major objective of ABMI monitoring, and there is concern that lure formulations change over time, potentially ruining confidence in long-term trend estimates if only lured sites were used. ABMI therefore uses four deployments at each site (separated by 600m), with two lured and two unlured. In addition to hedging bets about whether data from lured or unlured sites will be more valuable in the future, this paired design provides a strong way to estimate the effect of lure. Direct comparisons of lured and unlured deployments are not confounded by geographic location, year, or, with enough samples, microhabitats.
Confirming our concerns about using uncorrected-for lure in trend estimates, several species have shown apparent changes in the lure effect over the three years of ABMI sampling (Figure below; the four points left to right for each species are 2015, 2016, 2017, and 2018). Error bars are 90% CI’s, from bootstrapping with the site as the resampling unit). For example, the lure effect is stronger for bears, canids and wolverines in 2017 compared to 2016 and 2015, although this pattern was muted slightly in 2018. Marten and fisher might shower a lesser lure effect in 2017, but sample size are small for those species. The geometric mean lure effect for the nine main carnivores was 3.3 in 2015, 3.0 in 2016, and 4.6 in 2017. The non-carnivores, which generally don’t have strong responses to lure, do not show any consistent trends over time, although there are anomalous individual years for a few species.
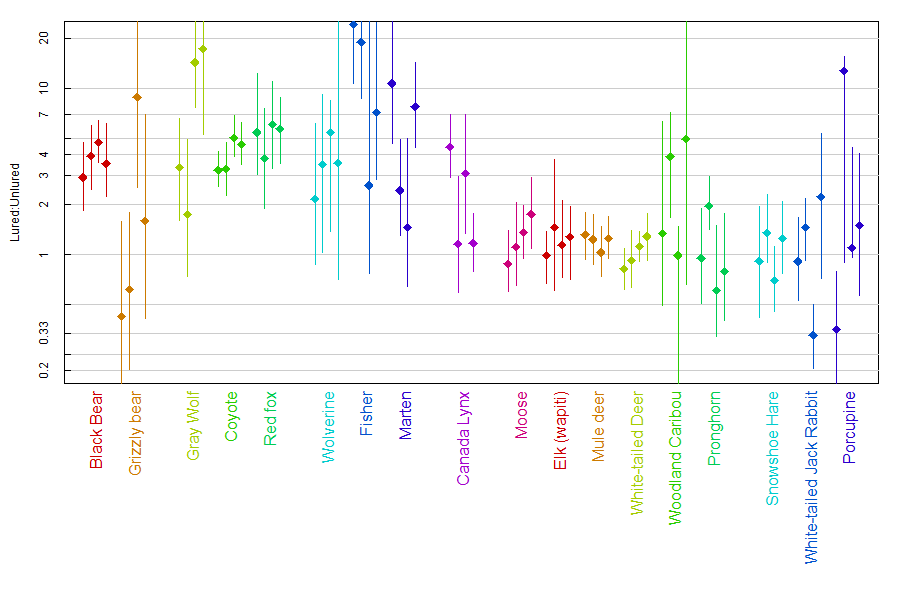
Lure effect on density over time.
The correction factors used when combining density estimates of lured and unlured camera deployments to generate density estimates for a broader region are listed in the table below.
| Species | Correction Factor |
|---|---|
| Gray Wolf | 6.12 |
| Black Bear | 3.91 |
| Coyote | 3.35 |
| Woodland Caribou | 2.98 |
| Canada Lynx | 2.88 |
| Pronghorn | 1.54 |
| Mule deer | 1.52 |
| Moose | 1.51 |
| Elk (wapiti) | 1.25 |
| Snowshoe Hare | 1.07 |
| White-tailed Deer | 0.99 |
Previous: Density at individual deployments