Time cameras are operating
The next ingredient in the density calculation is accounting for the total time that the camera deployments are operating. For many cameras, the total operating time is simply the time from just after the initial set-up to just before the final collection. However, some cameras fail before they are picked up, most often because they run out of memory or battery power after taking many pictures of cows, vegetation or occasionally perching birds. Other cameras fail because they fall over or are knocked over by cows. We use specific criteria for determining when a camera is too displaced to use – if the 5m pole is no longer in the image field, or the camera is tilted >30° from horizontal. Some of those may be re-established either during a mid-season visit or simply when the camera tilts back (e.g. if it is on a post that cows lean on), leading to a gap in operating time for the camera.
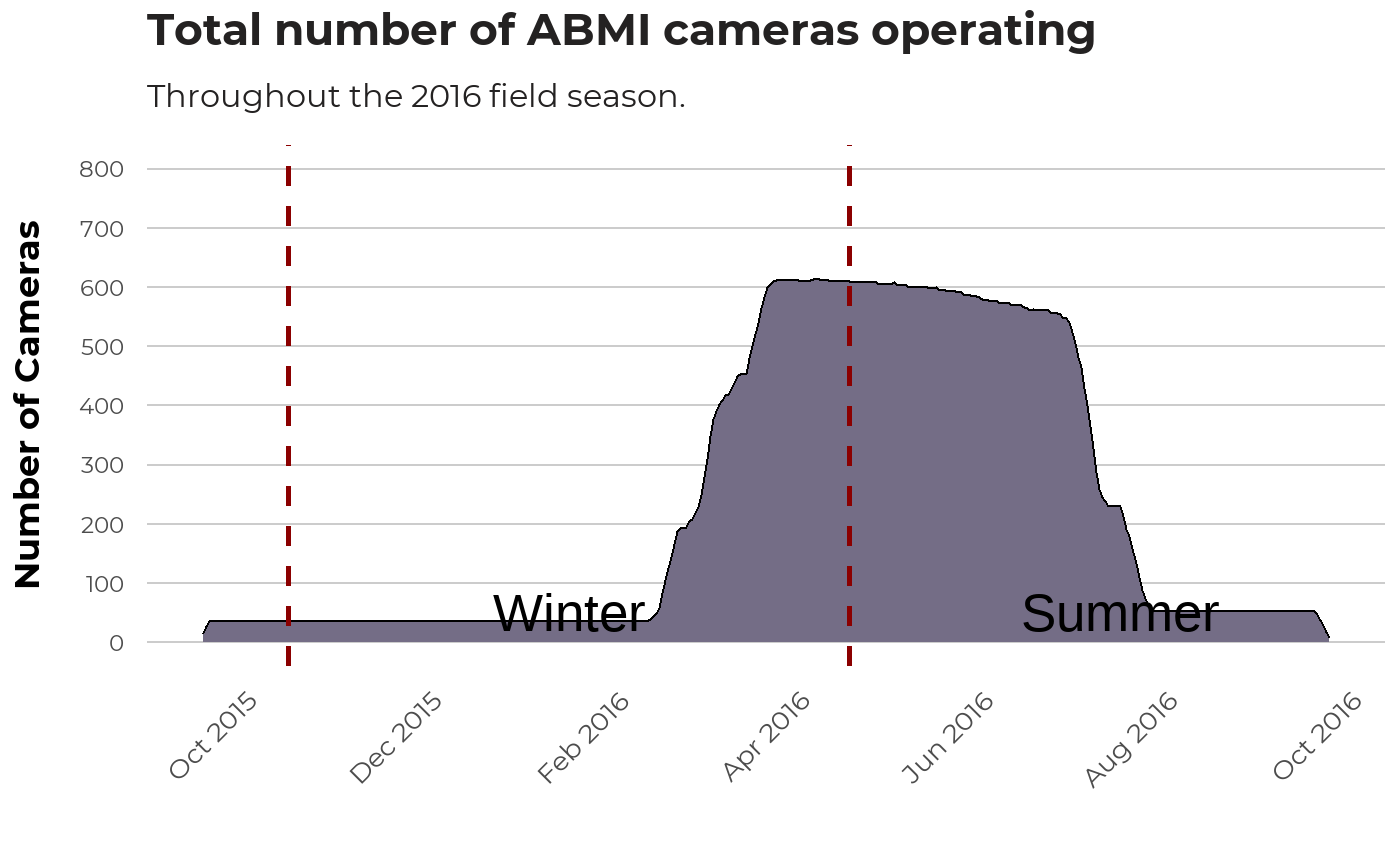
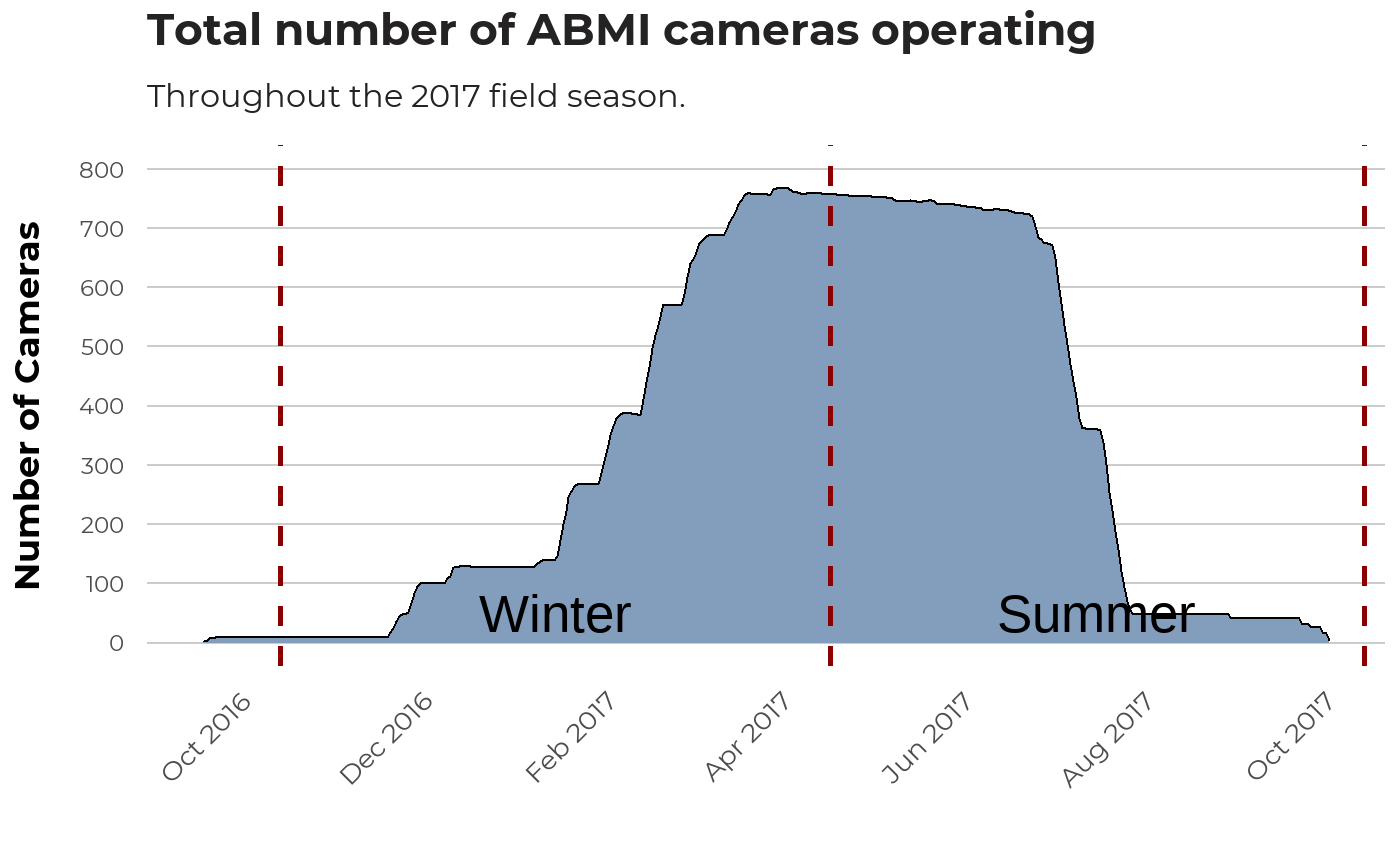
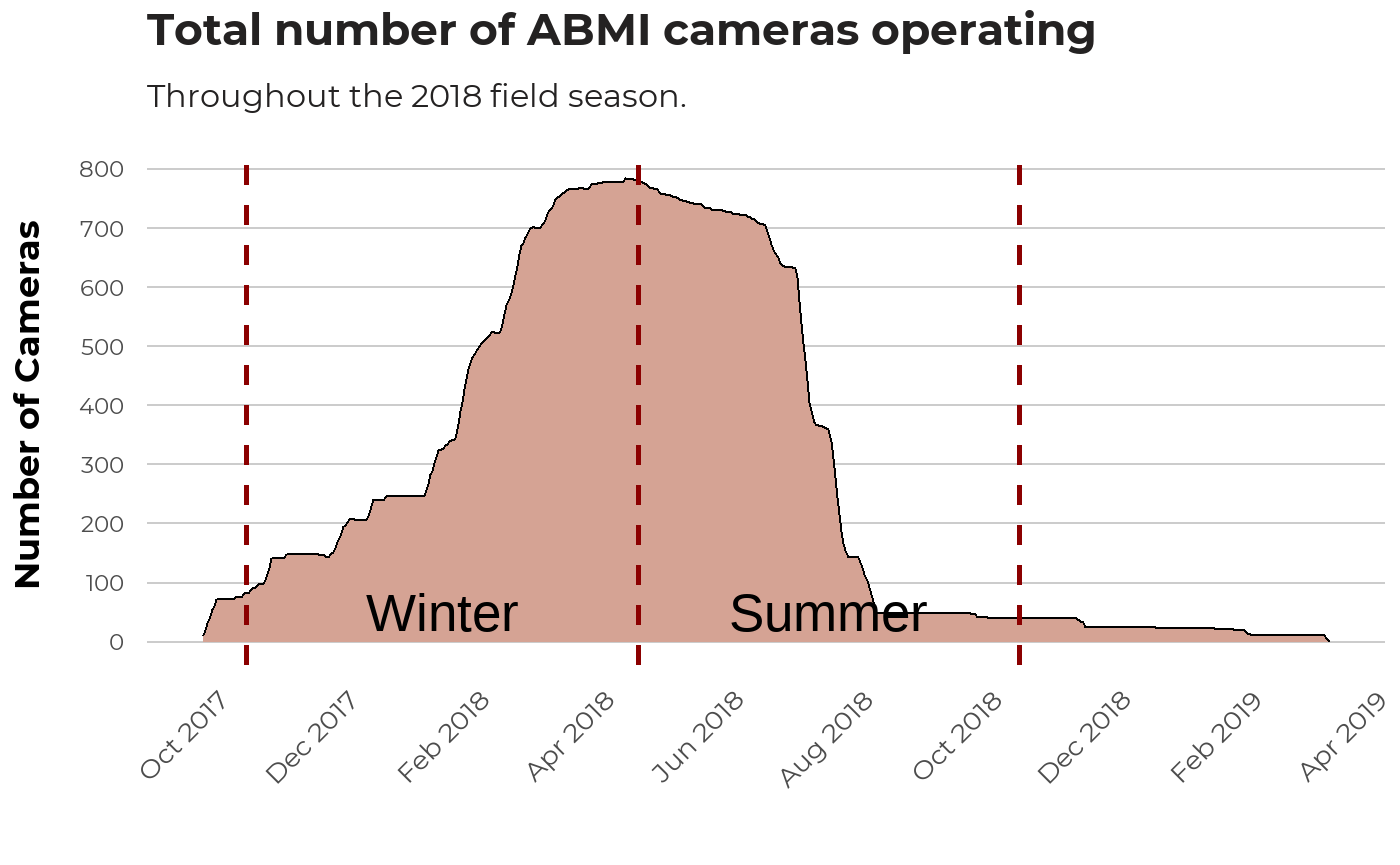
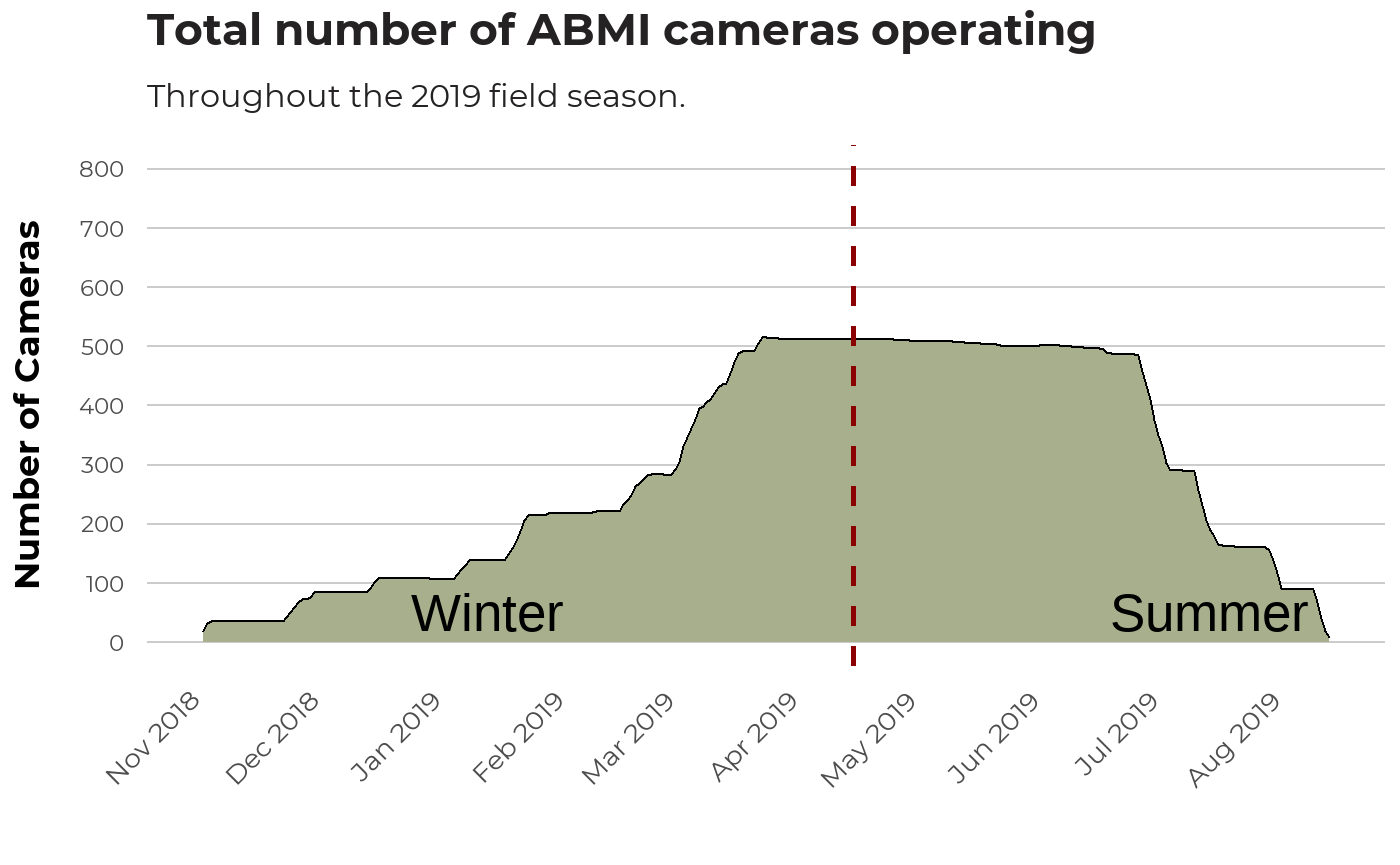
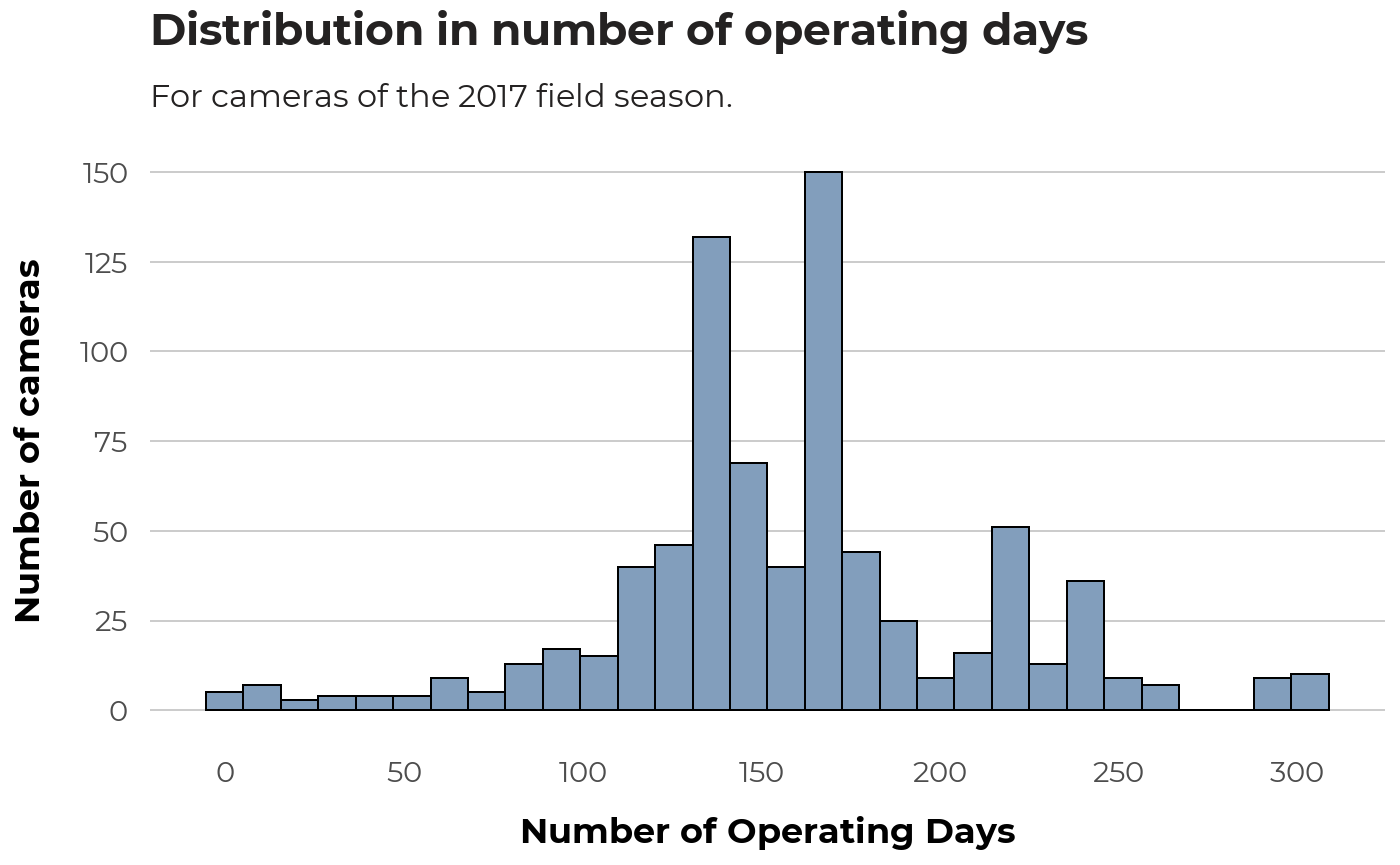
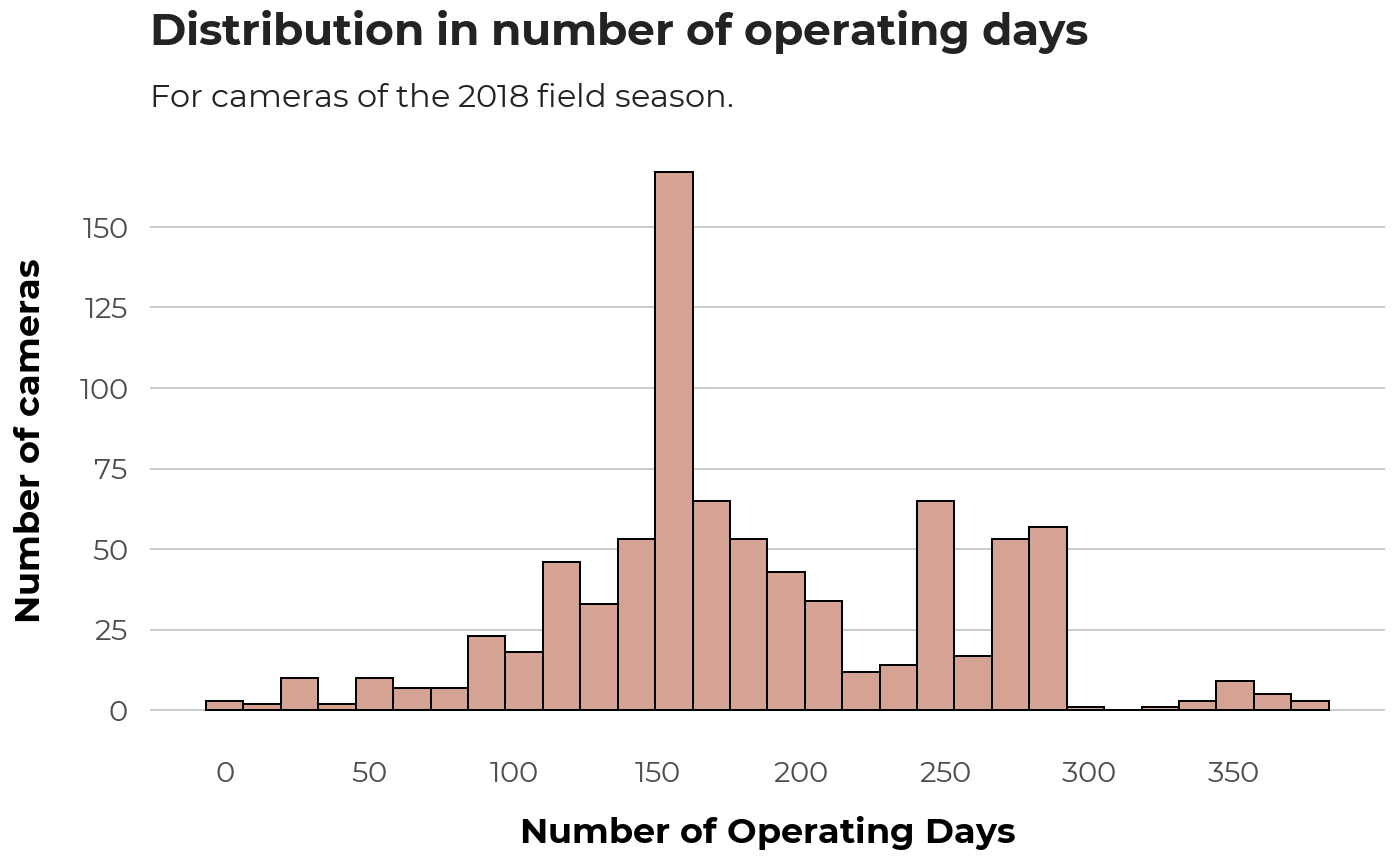
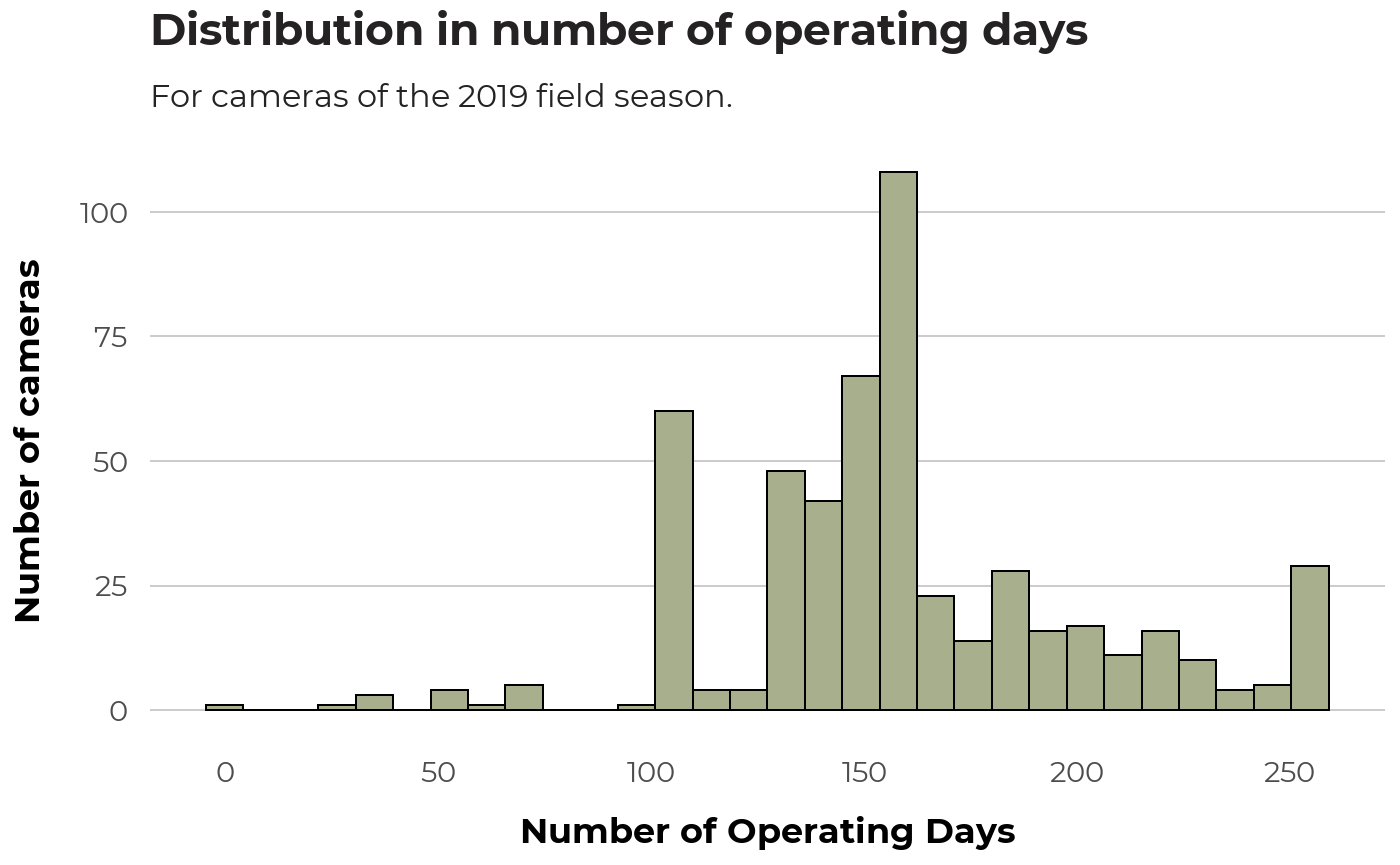
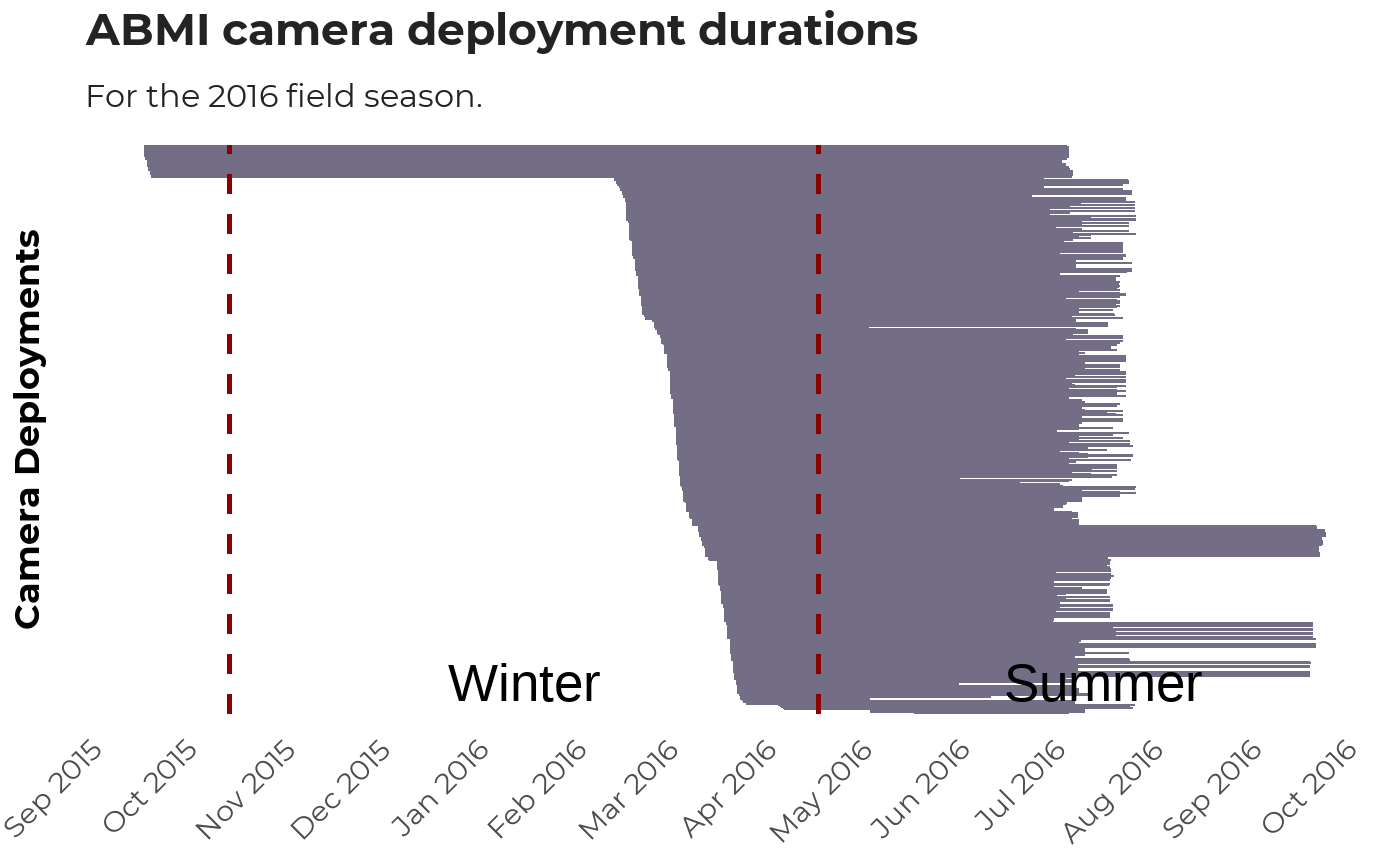
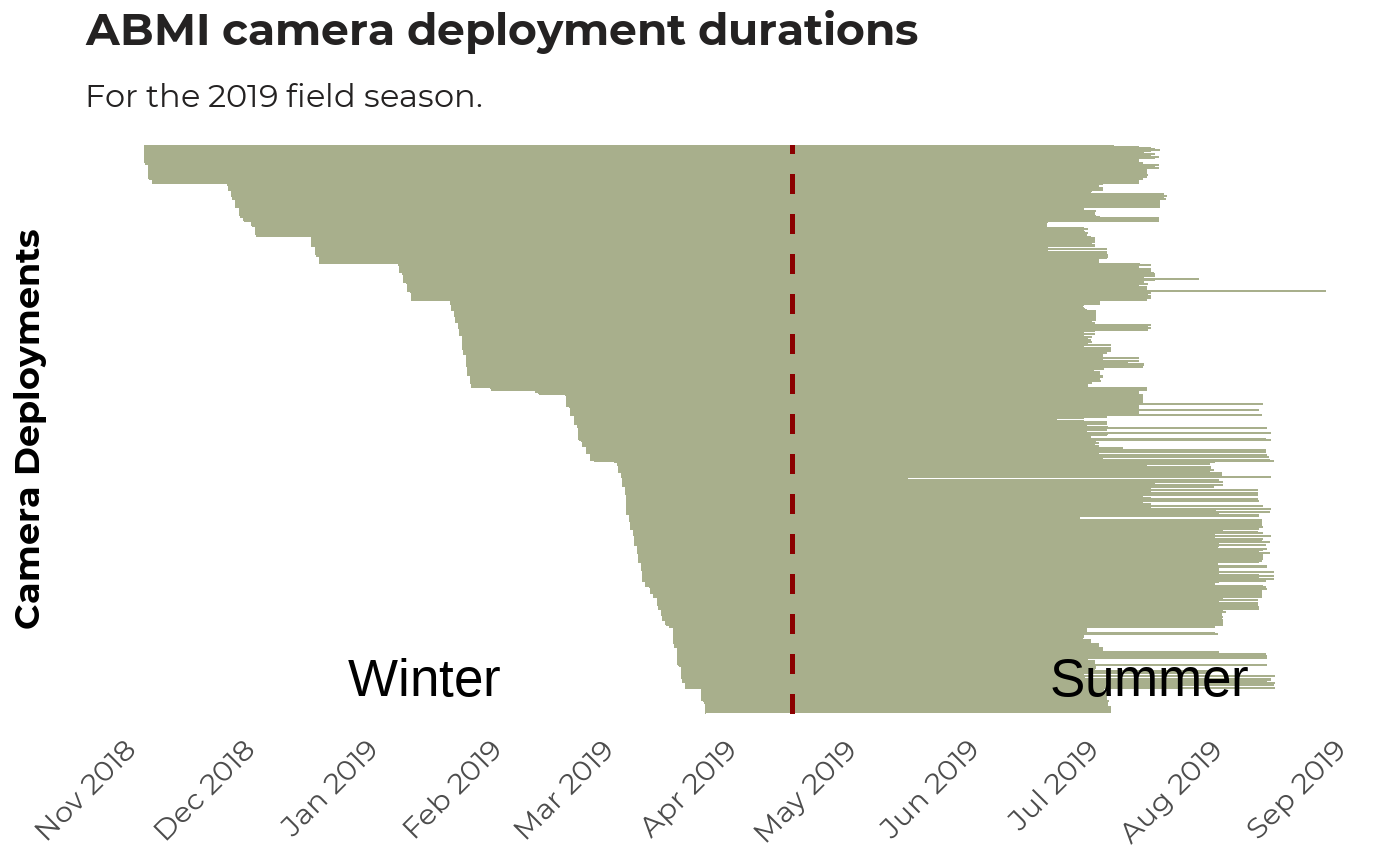
The time that each ABMI camera was operating are illustrated in the plots below. Many off-grid cameras, which target specific habitat types to improve habitat models or address other specific questions, or non-ABMI studies incorporated into the ABMI database, are set out at different times on-grid cameras. Recent years have included some cameras that were deployed in the fall and left out through the winter and following summer. Variation in start and end dates has increased over the four years, due to operational logistics (crew availability and site access). Cameras in the south-central part of the province were more likely to have short operating times because of cows. Besides creating different total operating times that need to be included in the density estimates, the varying deployment periods interact with seasonal variation in detectability of different species, which we need to address in the analysis.
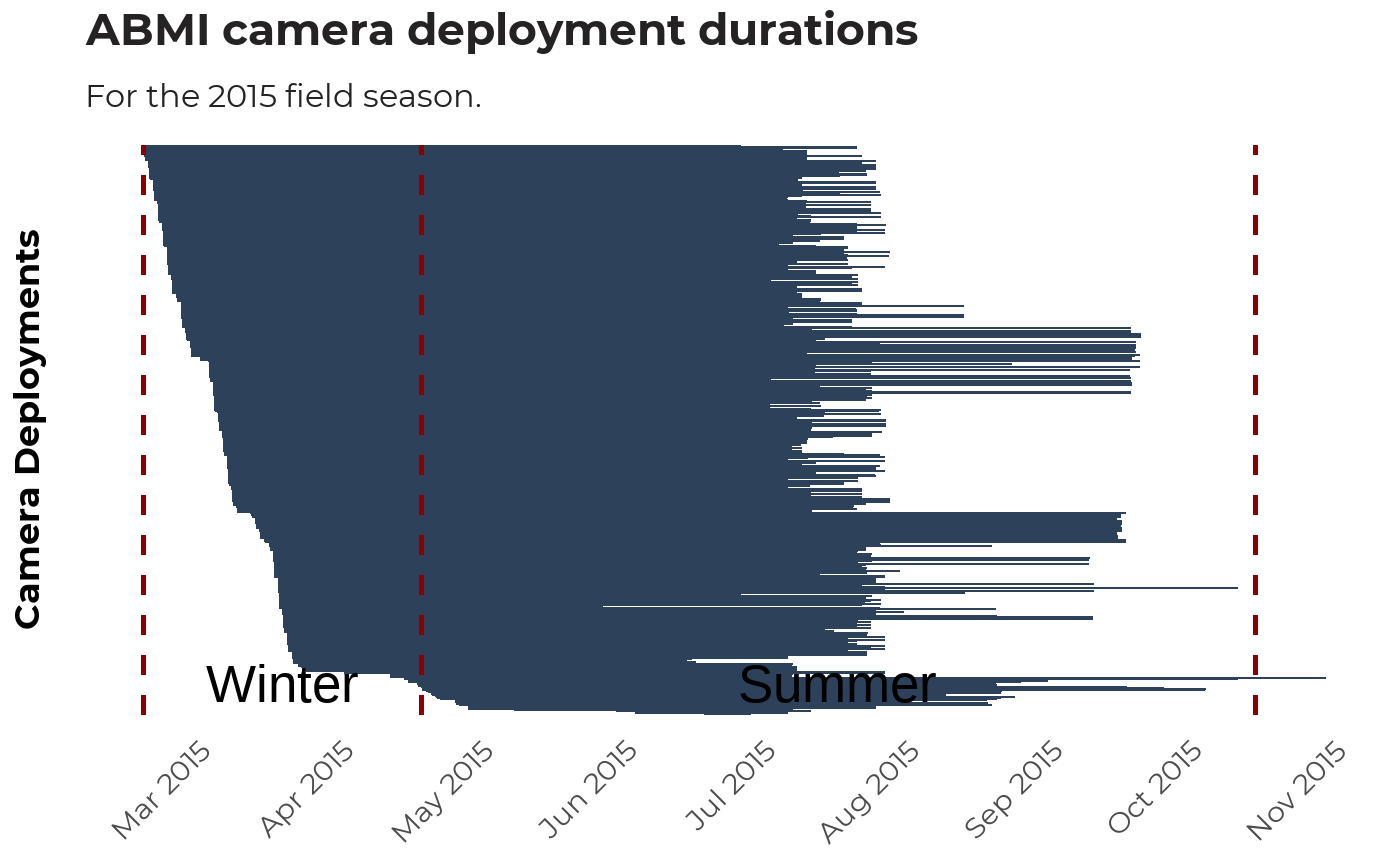
Deployment durations
The following plots illustrate the patterns of camera placement and take-down (or failure) over the course of each field season.


Total deployments over time
These plots show the total number of cameras operating at each point in time over the course of a sampling season.